Menu
Deploying large language models (LLMs) efficiently requires robust monitoring tools. These tools track infrastructure metrics like GPU/CPU usage, memory, and latency, as well as LLM-specific data such as token usage and costs. Without monitoring, teams risk performance bottlenecks, cost spikes, or system crashes. Here's a breakdown of six leading tools and how they address these challenges:
Each tool has strengths and trade-offs, ranging from open-source flexibility to managed service simplicity. Below is a quick comparison:
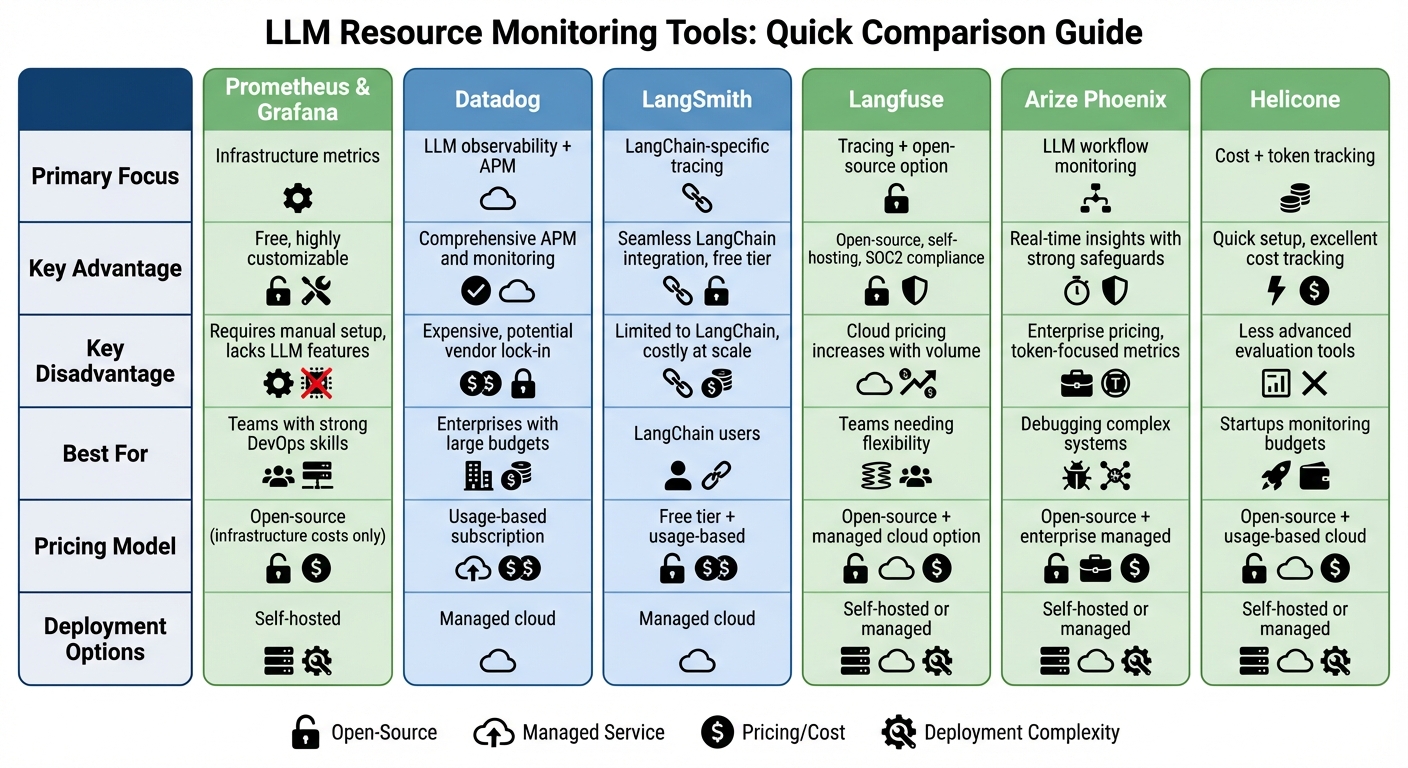
| Tool | Primary Focus | Key Trade-Off | Best For |
|---|---|---|---|
| Prometheus/Grafana | Infrastructure metrics | Requires manual setup | Teams with strong DevOps skills |
| Datadog | LLM observability + APM | Higher costs | Enterprises with large budgets |
| LangSmith | LangChain-specific tracing | Limited to LangChain workflows | LangChain users |
| Langfuse | Tracing + open-source option | Costs rise with managed service | Teams needing flexibility |
| Arize Phoenix | LLM workflow monitoring | Enterprise pricing | Debugging complex systems |
| Helicone | Cost + token tracking | Limited evaluation tools | Startups monitoring budgets |
Choose based on your team's technical expertise, budget, and monitoring needs. Combining tools (e.g., Prometheus for infrastructure and Langfuse for LLM insights) can provide a well-rounded solution.
LLM Resource Monitoring Tools Comparison: Features, Pricing, and Best Use Cases
Prometheus is a go-to tool for gathering essential infrastructure metrics in LLM deployments. With exporters like node_exporter and cAdvisor, it tracks data such as CPU usage, load averages, memory stats (RSS, cache, and swap), disk I/O performance, and network metrics like bandwidth and packet errors. For GPU-intensive tasks, NVIDIA's DCGM exporter adds GPU-specific details, including utilization, VRAM consumption, temperature, power draw, and per-process insights. In setups with a single GPU, the focus is on utilization and VRAM headroom. In contrast, multi-node clusters aggregate this data to identify and address load imbalances.
While Prometheus and Grafana excel at hardware monitoring, LLM deployments often demand more specialized metrics. These tools don’t come with built-in LLM-specific features, so teams typically create custom metrics to fill the gap. For instance, LLM gateways can emit counters like llm_tokens_generated_total, llm_request_latency_seconds, and llm_gpu_seconds. Grafana then uses these to display visuals such as tokens generated per model, latency patterns, and estimated costs per 1,000 tokens. For more advanced needs, teams often integrate with tools like Langfuse or LangSmith, which offer capabilities like prompt tracing, evaluation scoring, and implementing guardrails - features that go beyond what Prometheus and Grafana provide natively.
Prometheus and Grafana are highly compatible with Kubernetes, major cloud services, and OpenTelemetry. In Kubernetes-based LLM setups, tools like Prometheus Operator, kube-state-metrics, and node_exporter gather information on pod, node, and cluster health, while cAdvisor focuses on container-level CPU and memory data. For cloud environments, exporters designed for AWS, GCP, and Azure provide metrics such as GPU instance uptime and network egress, which Prometheus collects and Grafana visualizes alongside custom application metrics. OpenTelemetry integration adds another layer, enabling traces and metrics to flow into Prometheus. This makes Grafana a central hub for visualization, even when combined with specialized LLM monitoring tools.
Both Prometheus and Grafana are open-source, with Prometheus licensed under Apache 2.0 and Grafana OSS available as a free platform. This means there’s no licensing cost - expenses are limited to infrastructure requirements. Hosting these tools in Kubernetes gives you control over scrape intervals and data retention policies, but as metrics grow, you'll need to plan for sharding or federation. Managed services based on these technologies can ease operational burdens but often charge based on factors like the volume of ingested metrics, retention duration, or active series. High-frequency scraping of GPU and LLM request data can quickly generate large datasets, so many U.S.-based teams tweak scrape intervals and metric granularity to strike a balance between visibility and storage costs.
Datadog monitors infrastructure metrics through host and container agents, keeping tabs on CPU, GPU, RAM, disk I/O, and network throughput across LLM-serving nodes hosted on AWS, GCP, or Azure GPU instances. For metrics specific to LLMs, teams often track token counts per request, tokens processed per second, and request latency distributions. These can be logged as custom metrics or captured using Datadog's APM traces and logs, with tags for model, endpoint, and customer identifiers. Datadog’s integration with cost dashboards also allows teams to monitor USD cost per request, cost per 1,000 tokens, and monthly LLM expenses in real time, broken down into metrics like $/minute or $/hour. This foundational data lays the groundwork for more detailed insights into LLM performance.
Expanding on core metrics, Datadog’s SDK automatically instruments calls to platforms like OpenAI, LangChain, AWS Bedrock, and Anthropic. This means teams can capture latency, token usage, and error data without altering their code. Each LLM call is logged as an APM span or event, enriched with details such as model name, prompt length, completion length, temperature settings, and cache hits. The platform also includes features to detect issues like hallucinations, failures, prompt injections, and data leaks. In 2025, Datadog introduced LLM Experiments, enabling teams to test prompt changes against live production data before rolling them out. Reliability metrics - such as error rates, timeouts, and retries - are readily available, alongside performance indicators like p95/p99 latencies for specific models and routes. Additionally, secondary evaluation models or rules engines compute quality and safety metrics, such as toxicity scores or policy violations, which are then logged back into Datadog as metrics or tags.
Datadog’s integrations make it easier to monitor LLMs across major U.S. cloud providers by automatically pulling in GPU instance metrics for types like AWS p4d and g5, as well as managed services like API Gateways and load balancers that support LLM endpoints. The platform also integrates with common databases and vector stores - such as PostgreSQL, Elasticsearch, Redis, and their cloud-managed equivalents - allowing teams to monitor retrieval-augmented generation (RAG) components alongside LLM performance. With OpenTelemetry and language-specific APM libraries, Datadog can instrument LLM frameworks and orchestration layers. This enables tracing each chain or tool call as spans, complete with tags for prompt templates, tools, and agents. As a result, teams can trace an entire LLM workflow - from the initial HTTP request through retrieval and tool calls to the final completion - within a single Datadog trace.
Datadog operates on a usage-based pricing model, factoring in host/container count, APM and log ingestion, and custom metrics volume. For LLM workloads generating millions of daily calls, costs can rise quickly due to high-cardinality or high-frequency metrics. To manage this, teams often aggregate metrics by model or route and apply sampling to reduce custom metric volume. Logging requests and responses - especially when partially redacted - can also lead to significant ingestion costs. To address this, teams use retention controls, exclusion filters, and cheaper archival options for long-term data, while maintaining a smaller, recent dataset for debugging purposes. Many U.S. teams opt to aggregate spend metrics daily or hourly rather than log every request. This approach provides enough visibility for budgeting and anomaly detection without incurring excessive telemetry costs.
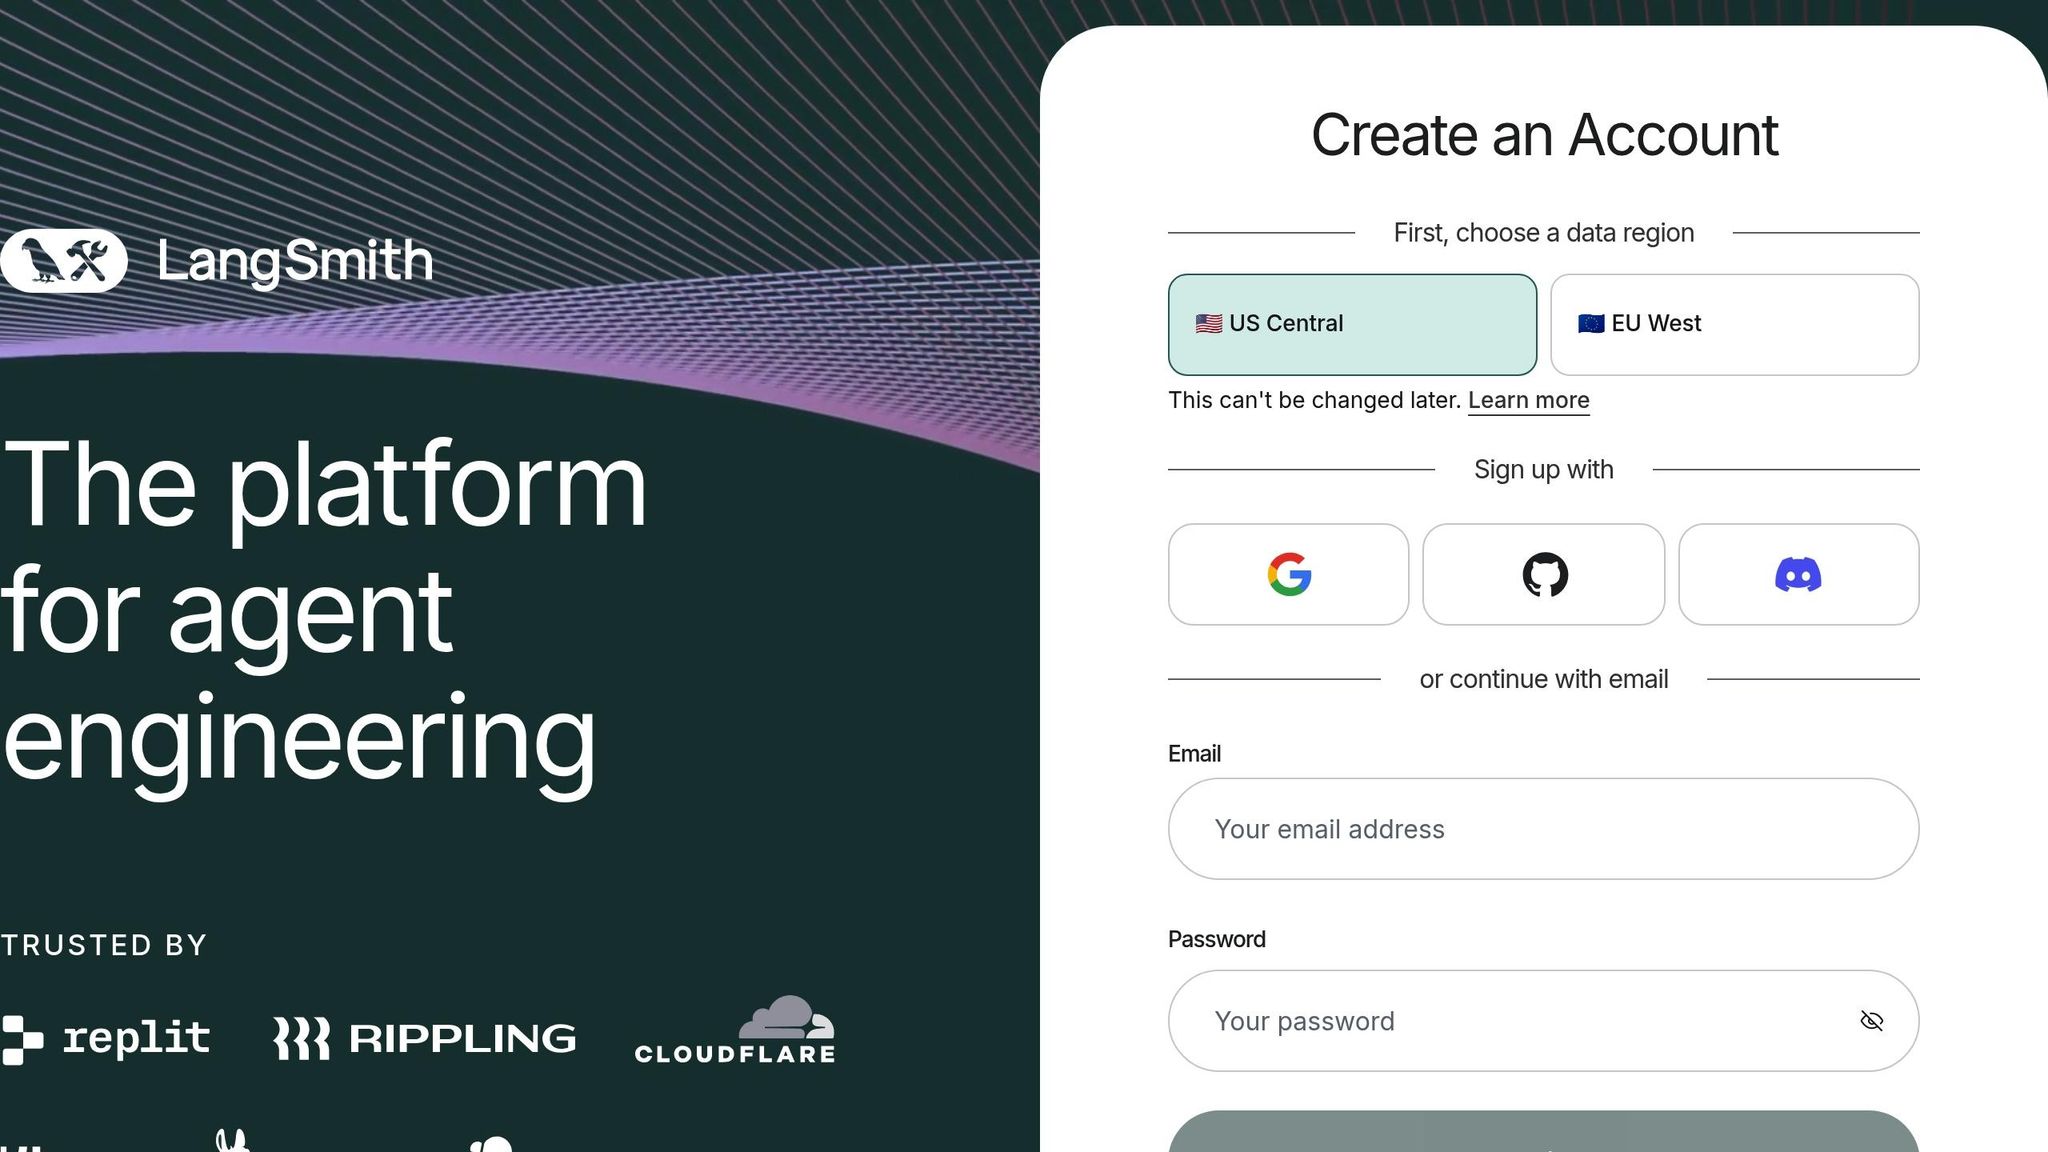
LangSmith provides detailed insights into every LLM call, capturing metadata like model name, latency, token usage, and whether the call succeeded or failed across traces. This data feeds into live dashboards that track costs, latency, and response quality in real time. Teams can monitor spending in USD, broken down by feature, user, or environment. By aggregating token and latency data, LangSmith calculates costs per 1,000 tokens and monthly LLM expenses, catering to the reporting needs of U.S. businesses. Additionally, teams can export these metrics via OpenTelemetry to tools like Prometheus or Grafana, enabling a unified view of infrastructure monitoring combined with LangSmith’s LLM-specific insights. This setup helps teams identify expensive prompts, slow processes, or unreliable models, allowing them to fine-tune routing strategies to stay within budget while meeting service level agreements (SLAs). These metrics form the foundation for LangSmith's advanced monitoring capabilities, explored further in the next section.
What sets LangSmith apart from general observability tools is its deep understanding of LLM workflows. Instead of treating calls as generic API requests, LangSmith focuses on LLM-specific components like prompts, chains, agents, and tools. It offers full-stack tracing, capturing every step in a workflow - from prompts and intermediate tool calls to final responses. This allows developers to pinpoint latency issues, quality dips, or failures at a granular level. For users of LangChain or LangGraph, enabling tracing is as simple as setting an environment variable, which then visualizes each chain run as a hierarchical trace. The platform also supports evaluation workflows, enabling teams to score LLM outputs for relevance, correctness, and safety using either built-in or custom evaluators. Production traces can double as regression tests, and conversation clustering reveals common user intents. Meanwhile, agent-specific metrics track tool usage and error rates. These tailored insights go beyond what generic application performance monitoring (APM) tools can offer.
LangSmith integrates seamlessly with LangChain, making it an ideal choice for teams already building agents, tools, or retrieval-augmented generation (RAG) pipelines with LangChain. It also supports broader use cases with SDKs for Python and TypeScript and OpenTelemetry integration, enabling teams to instrument workflows outside of LangChain and export data to their existing observability tools. LangSmith can work alongside AI gateways and standard monitoring platforms - while it handles LLM-specific traces and metrics, tools like Prometheus or Grafana continue to monitor underlying CPU and GPU performance. Offered as a managed cloud service, LangSmith appeals to startups and mid-sized companies in the U.S. that prefer minimal operational overhead. For organizations working with Artech Digital, LangSmith can be embedded into custom AI solutions, delivering continuous, reliable monitoring. This flexible integration approach supports efficient and scalable deployments.
LangSmith offers a free tier, making it accessible to startups or teams experimenting with LLMs who want to explore tracing and evaluation without upfront costs. Beyond the free tier, pricing is usage-based, scaling with the volume of traces and evaluations. As a managed cloud service, LangSmith eliminates the need for self-hosting, reducing operational complexity for teams that value speed and simplicity. Industry comparisons highlight LangSmith as a strong fit for teams deeply invested in LangChain or those looking for seamless integration between development, testing, and production monitoring.
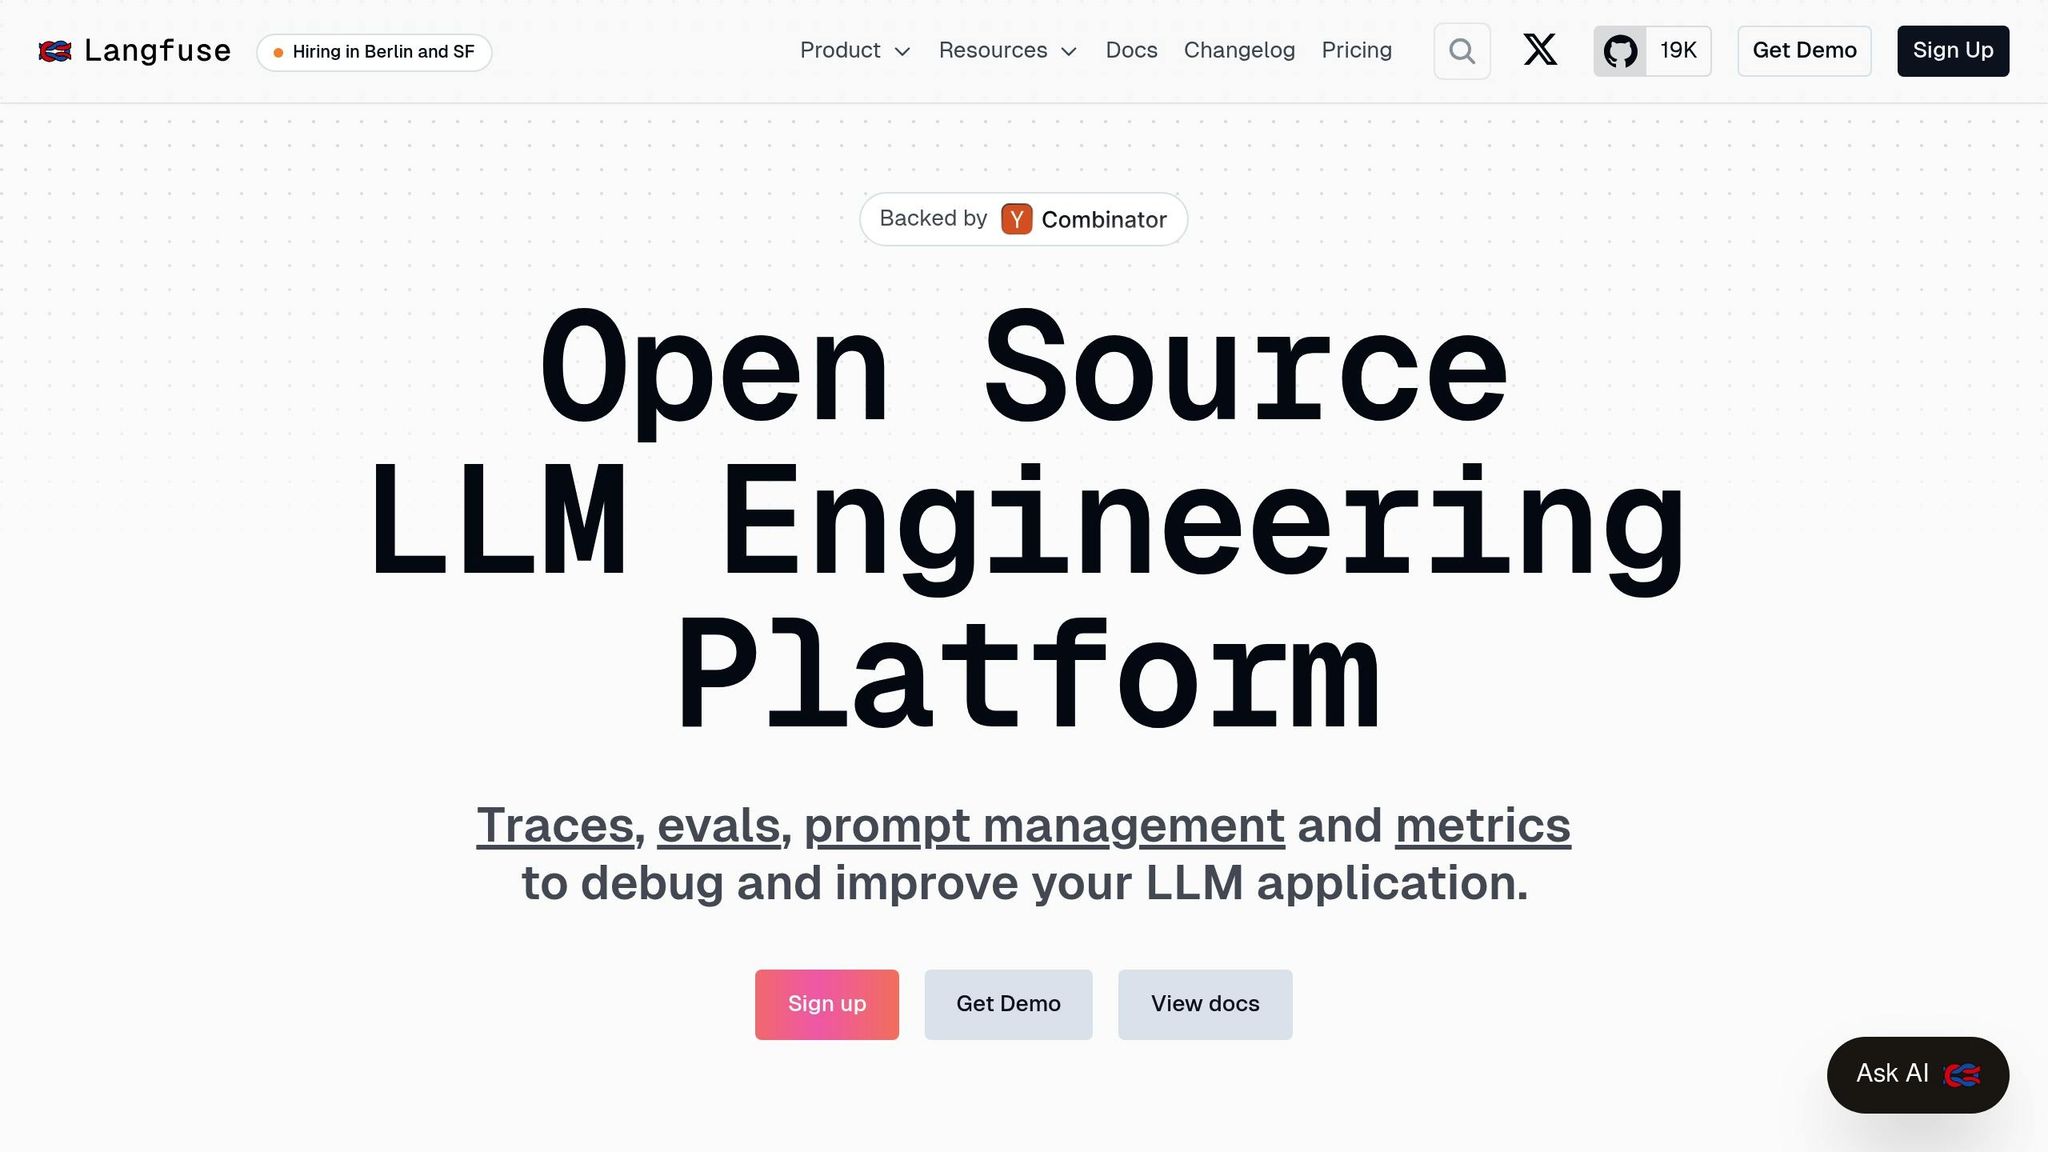
Langfuse takes a focused approach to monitoring, centering on LLM-specific performance metrics rather than hardware stats like CPU or GPU usage. It tracks token usage, latency, and cost per LLM call, presenting these insights through intuitive dashboards. While it skips raw hardware metrics, Langfuse integrates with OpenTelemetry and employs session tracking to map out complete user journeys and cost tracking across multi-step workflows. This focus enables a deeper understanding of workflow performance.
Langfuse goes beyond basic metrics by offering detailed tracing for better observability. It provides full visibility into LLM applications, tracing every call - including prompts, responses, intermediate steps, and errors. The platform is framework-agnostic, working seamlessly with tools like LangChain, OpenAI SDK, and Anthropic. Its emphasis on agent-style and multi-step workflows makes it especially useful for debugging complex processes involving multiple LLM calls and tool integrations.
Additionally, Langfuse supports both human and AI-based evaluations to assess model outputs. It also features centralized prompt management, enabling versioning, testing, and deployment of prompts. This combination of tracing, evaluation, and prompt control turns raw logs into actionable insights, helping teams refine their workflows.
Langfuse's integration capabilities add even more value to its tracing features. Its framework-agnostic SDK can integrate with a variety of tech stacks, supporting numerous LLM providers and frameworks. The platform also allows batch exports for offline analysis. Whether in development or production, Langfuse enables continuous monitoring of AI deployments. With SOC 2 compliance, it meets the needs of organizations with strict security standards, and its flexible deployment options cater to teams at different growth stages.
Langfuse is open source under the Apache 2.0 license, giving teams the option to self-host and pay only for their infrastructure. For those who prefer a managed solution, Langfuse offers a cloud-hosted service with usage-based pricing, where costs adjust based on the volume of traces and evaluations. This dual approach provides flexibility: self-hosting ensures complete data control for privacy-conscious teams, while the cloud option reduces operational complexity for those prioritizing ease and speed.
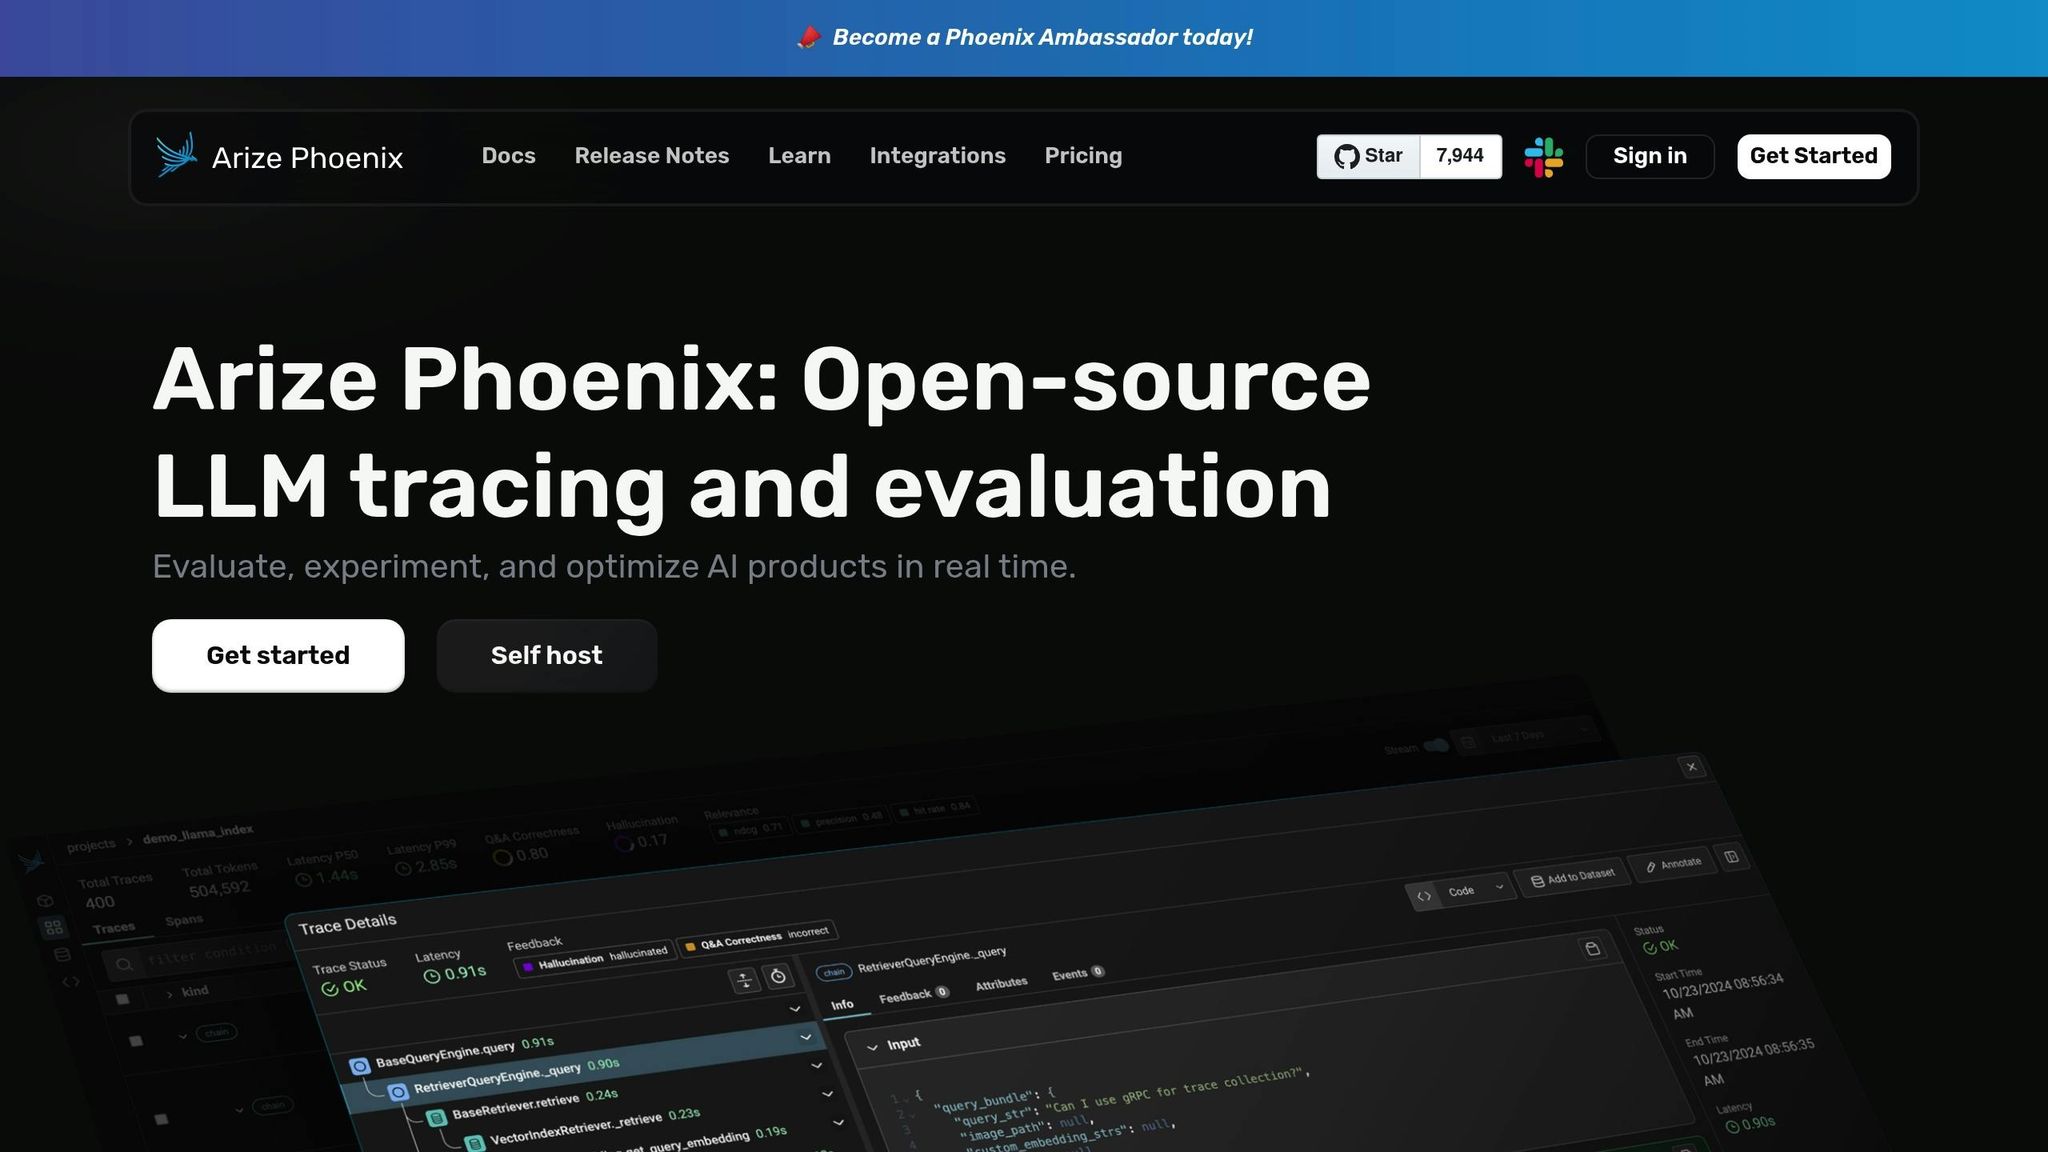
Arize Phoenix shifts the focus from traditional infrastructure metrics to data specific to LLMs and retrieval-based systems. Instead of tracking low-level GPU usage, it monitors operational metrics like token counts, request and response latency, error rates, and traffic volume, all segmented by model, route, or feature. This allows teams in the U.S. to break down costs by feature or user group, calculate token-based expenses, and pinpoint latency or error spikes to particular prompts or retrieval-augmented generation (RAG) pipelines. With Phoenix timelines, identifying regressions after prompt or model updates becomes straightforward, and customizable dashboards make it easy to set and monitor SLOs for metrics like P95 latency and failure rates. These insights complement traditional hardware monitoring tools, offering a broader perspective on performance and cost.
Arize Phoenix goes beyond generic monitoring tools by structuring each interaction with LLMs for in-depth analysis. It captures every component of an LLM workflow - prompts, completions, retrieved documents, embeddings, and intermediate steps - as structured traces. This approach enables detailed debugging for RAG workflows, including step-by-step latency tracking, evaluation of retrieval quality, and side-by-side comparisons when testing different prompts or models. The platform also identifies LLM-specific quality signals, such as hallucination rates, relevance scores, and safety metrics, tying them back to individual prompts or document sections to support rapid iteration. Additional features include real-time tracing, prompt-level monitoring, and integrated guardrails to address bias and toxicity concerns.
Arize Phoenix is designed to fit seamlessly into existing LLM workflows. It provides Python SDKs and supports OpenTelemetry-compatible tracing, enabling easy instrumentation with minimal coding. The platform integrates with popular frameworks and tools like LangChain, LlamaIndex, and OpenAI or Anthropic SDKs, automatically generating spans for each step in a chain or agent workflow. Similar to LangSmith and Datadog, it uses OpenTelemetry to centralize telemetry data, supporting a unified monitoring approach. Teams can start by instrumenting their API gateway or LangChain-based agents to send traces to Phoenix while continuing to export telemetry to platforms like Prometheus, Grafana, or Datadog. This hybrid setup allows Phoenix to act as a specialized observability tool for LLMs while complementing broader system-level monitoring.
Arize Phoenix offers both open-source and managed deployment options. The open-source version allows self-hosting, giving teams full control over data residency and compliance, with deployment supported on AWS, GCP, or Azure using container or Kubernetes workflows. For enterprises, the managed version simplifies operations, with pricing based on trace volume, evaluations, and data retention needs. This dual approach provides flexibility: self-hosting is ideal for teams prioritizing privacy and control, while the managed option reduces operational overhead. Both models are designed to capture application- and quality-level data tailored specifically to LLM monitoring requirements.
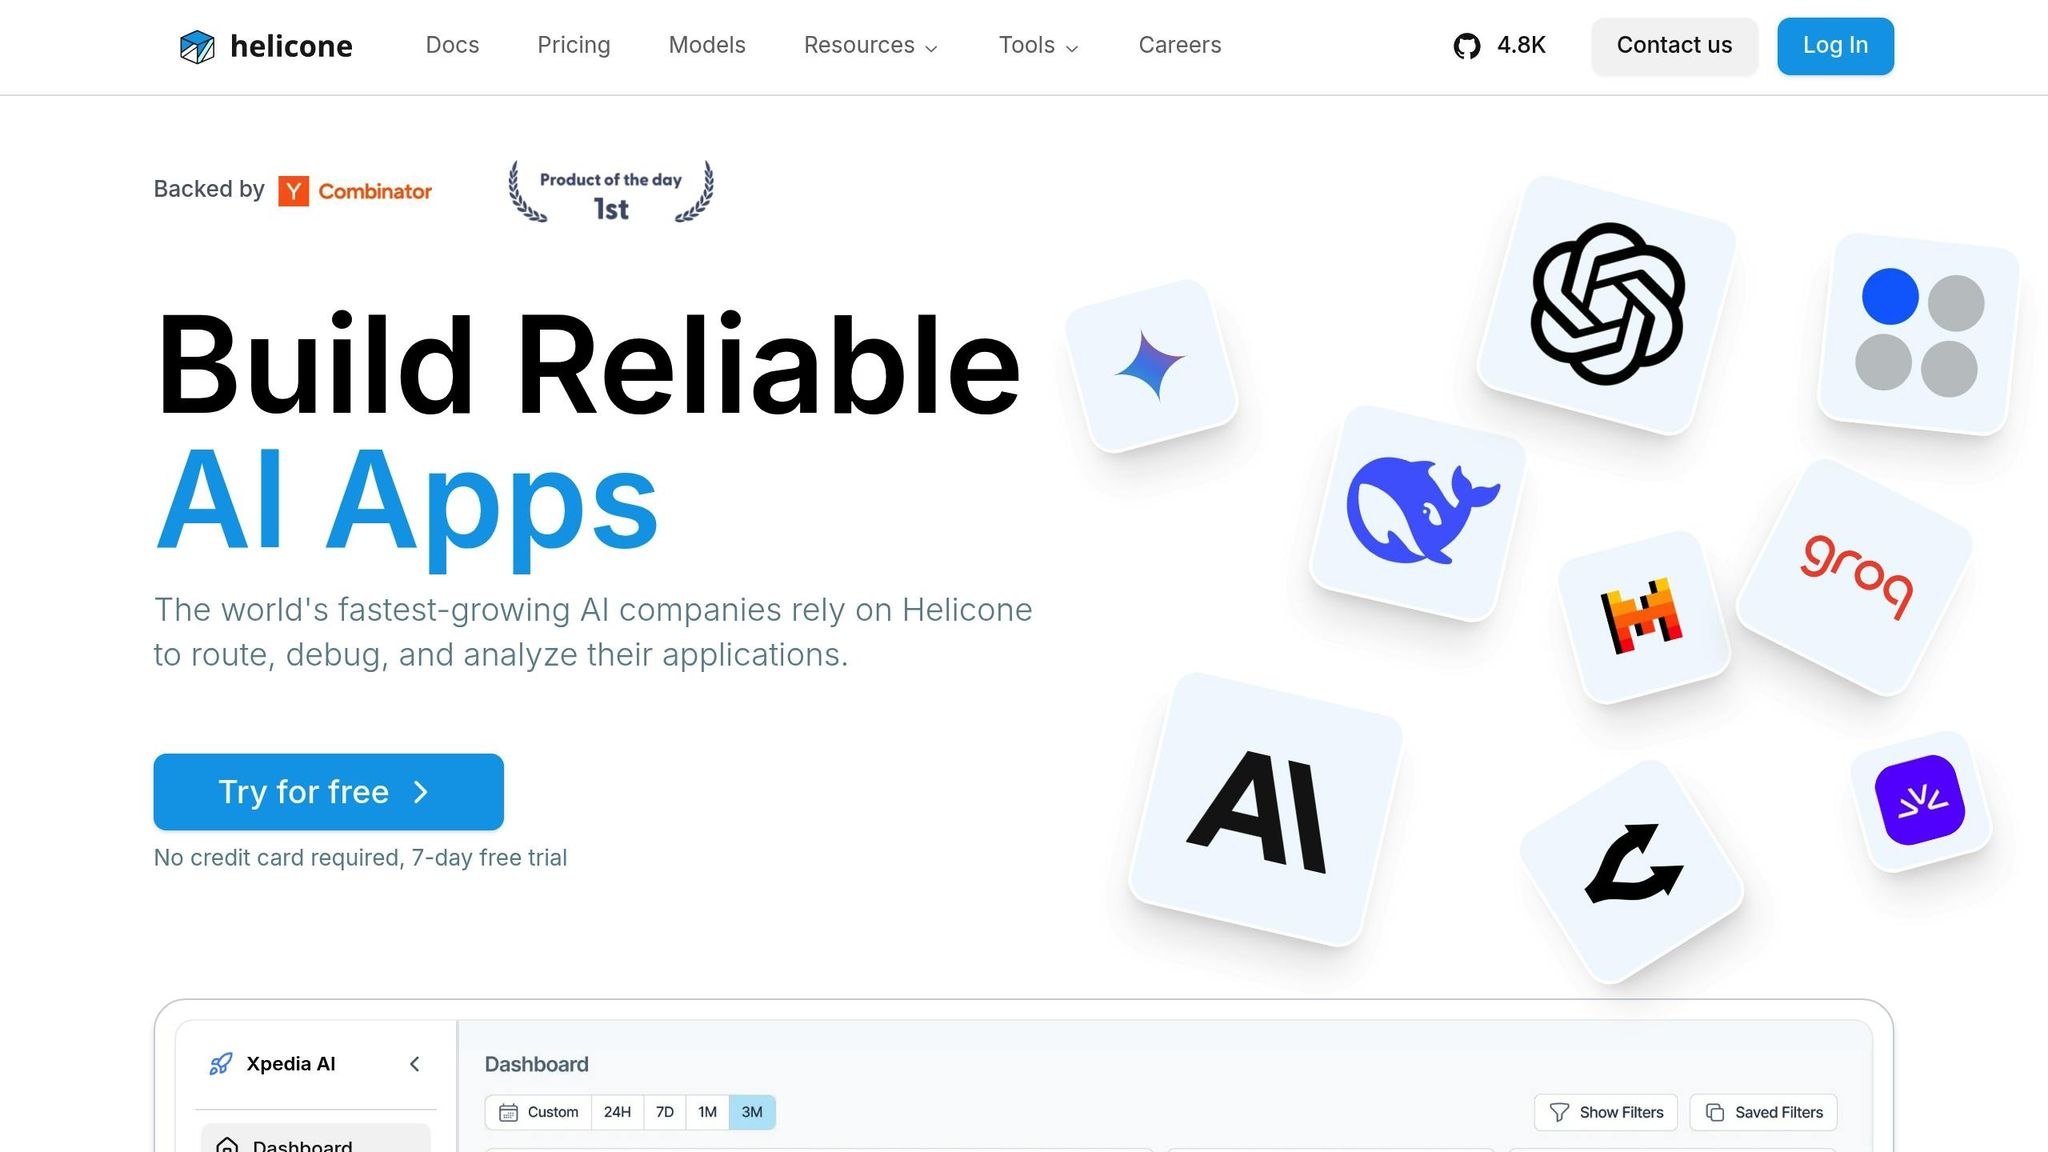
Helicone stands out as a gateway-based tool designed to provide detailed metrics for large language model (LLM) operations.
Helicone acts as an API gateway, sitting between your application and LLM providers like OpenAI or Anthropic. Instead of focusing on general infrastructure data, it captures request-specific metrics such as token usage, input and output lengths, per-request latency, and cost attribution. This setup is particularly useful for U.S.-based teams, allowing them to monitor usage spikes in real time and set budget alerts in USD to avoid overspending. By aggregating data from multiple providers, Helicone also enables teams to compare metrics like cost per 1,000 tokens and overall performance, making it easier to evaluate vendors before committing to long-term agreements.
Helicone logs every LLM interaction, including prompts, responses, errors, and performance metrics, with minimal overhead. The platform’s real-time alerts notify teams of usage spikes or failures as they happen. Thanks to its gateway design, Helicone provides end-to-end visibility into LLM workflows without requiring extensive code modifications. Additionally, its built-in caching system optimizes costs and reduces latency for repetitive prompts or system messages. This combination of observability, alerting, and caching makes it an excellent choice for chatbot projects and quick production rollouts.
Helicone integrates seamlessly with major LLM providers like OpenAI and Anthropic and works well with frameworks such as LangChain. Setting it up is straightforward - teams can install the Helicone proxy via npm or Python SDK, wrap their LLM calls, and configure API keys. Its vendor-agnostic design allows traffic routing across multiple providers, avoiding lock-in. For teams that use OpenTelemetry, Helicone supports exporting telemetry data to existing monitoring tools while centralizing cost tracking and access control. Organizations can start small by routing traffic from specific environments, like staging or a single microservice, and gradually expand to cover all LLM traffic. This approach makes deployment flexible and scalable, with more details on those options outlined later.
Helicone offers both open-source and managed deployment options. The open-source version is ideal for teams that prefer self-hosting, granting them full control over data residency and security. For those opting for the managed cloud service, pricing is usage-based and calculated in USD, depending on logged events or API requests. Caching and cost-control features help offset these expenses. Many teams begin with the free or self-hosted tier during development and early staging, transitioning to the managed service or scaled self-hosting as production demands grow. The platform also includes virtual API keys, which make it easy to allocate costs accurately across teams, projects, or customers. This feature is particularly useful for U.S.-based organizations looking to streamline financial reporting and chargebacks.
Every tool in the lineup has its own strengths and limitations when it comes to resource tracking, observability, and pricing. The key trade-offs often boil down to the flexibility of self-hosted solutions versus the simplicity of managed services. Here's a closer look at how they compare.
Prometheus and Grafana are free and offer a high degree of customization, making them excellent for tracking metrics like CPU, GPU, and memory usage through flexible dashboards. That said, they demand significant DevOps expertise to set up and maintain. Plus, they lack built-in features tailored for large language models (LLMs), such as prompt tracing or token usage monitoring.
Datadog LLM Observability provides a unified monitoring experience with detailed insights into latency, errors, and token usage. It integrates smoothly with existing Application Performance Monitoring (APM) systems, making it a strong choice for enterprises. However, its subscription-based pricing can be a barrier for startups, and there’s always the risk of vendor lock-in.
LangSmith simplifies things for LangChain users by offering full-stack tracing, prompt management, and a free tier for experimentation. But its reliance on LangChain limits its flexibility for other frameworks, and scaling up for production can lead to higher costs.
Langfuse shines with its open-source Apache 2.0 license, allowing teams to self-host and control costs. It also offers comprehensive tracing, SOC2 compliance, and framework-agnostic integrations. On the flip side, its cloud pricing can rise significantly with increased usage.
Arize Phoenix focuses on real-time tracing, cost and latency analytics, and provides robust safeguards for detecting bias and toxicity. However, its enterprise pricing structure leans heavily on token and latency metrics, which may not cover broader infrastructure monitoring needs.
Helicone is designed for quick deployment, with strong cost tracking features like budget alerts in USD and built-in caching. Its open-source, self-hostable gateway design ensures no vendor lock-in. That said, its evaluation tools and dashboards are less advanced compared to managed platforms.
When you break it down, the open-source tools - Prometheus/Grafana, Langfuse, and Helicone - offer cost control and self-hosting advantages but require more technical know-how. Managed services like Datadog and LangSmith, on the other hand, simplify observability but come with higher costs and potential vendor lock-in. Free tiers can be a good starting point for startups experimenting with LLM workflows, but as usage grows, enterprise pricing models often come into play. Your choice will depend on your technical skills, budget, and whether you value broad infrastructure monitoring or LLM-specific features more.
Here’s a quick comparison table to sum it all up:
| Tool | Key Advantage | Key Disadvantage | Best For |
|---|---|---|---|
| Prometheus/Grafana | Free, highly customizable | Requires manual setup, lacks LLM features | Teams with strong DevOps expertise |
| Datadog | Comprehensive APM and monitoring | Expensive, potential vendor lock-in | Enterprises using Datadog infrastructure |
| LangSmith | Seamless LangChain integration, free tier | Limited to LangChain, costly at scale | LangChain-native workflows |
| Langfuse | Open-source, self-hosting, SOC2 compliance | Cloud pricing increases with volume | Teams needing flexibility and control |
| Arize Phoenix | Real-time insights with strong safeguards | Enterprise pricing, token-focused metrics | Debugging and multi-agent systems |
| Helicone | Quick setup, excellent cost tracking | Less advanced evaluation tools | Startups tracking chatbot costs |
Choosing the right monitoring tool comes down to your deployment scale, budget, and how seamlessly it integrates with your existing systems. For small teams experimenting with LLM applications, starting with free tiers from tools like LangSmith or Langfuse is a no-brainer. These options let you monitor basic metrics like latency, errors, and token costs without any upfront expense. As your usage grows and production demands increase, enterprise solutions like Datadog or self-hosted Langfuse become more appealing for their reliability and data control.
A layered monitoring approach works best. Use tools like Prometheus and Grafana to track infrastructure metrics, while relying on Langfuse or Helicone for LLM-specific data such as token usage, latency, and costs. This setup provides a comprehensive view of both system health and model behavior. If your team already uses an observability stack, extending it with LLM modules - like those offered by Datadog - can simplify operations and reduce complexity.
Your integration needs should also steer your decision. For teams building with frameworks like LangChain or LangGraph, LangSmith offers simple, out-of-the-box tracing and prompt management. On the other hand, if you need a more flexible or framework-agnostic solution, Langfuse and Helicone support OpenTelemetry, allowing you to route traces to multiple backends. This flexibility avoids vendor lock-in and ensures unified visibility. Gateway-style tools like Helicone are especially useful for managing multi-provider deployments or keeping close tabs on costs, offering detailed per-tenant cost tracking.
Bringing infrastructure and LLM monitoring under one roof is key. Standardizing on OpenTelemetry makes it possible to integrate LLM traces into tools like Grafana, Datadog, or New Relic, giving you a unified view of resource usage and model performance. This clarity helps reduce operational overhead and ensures smoother workflows.
For organizations building custom AI agents or handling complex production systems, working with experts like Artech Digital can make a big difference. Their experience in custom AI agents, LLM fine-tuning, and production integrations can help you design a monitoring stack that not only meets your current needs but also scales for the future.
When choosing between open-source and managed tools for monitoring large language model (LLM) resources, it’s essential to weigh factors like control, customization, and ease of use.
Open-source tools provide a high level of flexibility and allow for deep customization, making them a strong fit for teams with advanced technical skills and specific requirements. That said, these tools often demand substantial maintenance and expertise to implement and manage effectively.
Managed tools, by contrast, prioritize convenience. They come with user-friendly interfaces, built-in support, and require minimal setup, which makes them ideal for teams seeking quick deployment and dependable performance without the need for ongoing, resource-intensive upkeep.
Ultimately, the right choice depends on your team’s technical expertise, security considerations, and how much customization your project demands.
Using several monitoring tools together can significantly boost the efficiency of deploying large language models. Why? Because it gives you a more detailed and well-rounded picture of how resources are being used. This makes it easier to pinpoint performance bottlenecks, fine-tune resource allocation, and keep operations running smoothly.
When you combine tools, you can monitor performance in real time, tackle issues before they escalate, and cut down on downtime or delays. This approach improves scalability and reliability while keeping operational costs in check - all without compromising the model's performance across different deployment environments.
To manage the cost and performance of large language models (LLMs), it’s essential to keep an eye on a few key metrics:
Focusing on these metrics allows you to maintain a balance between strong performance and efficient resource use, keeping your LLM deployment effective without overspending.
.png)

.png)